The Yeti Data Brigade: Turning a Daily Podcast Into Data
I listen to The Best One Yet most mornings. Every weekday it drops three short business stories: a company that just IPO’d, a brand doing something clever, a number that says more than it should. It’s a great way to keep a finger on the pulse of what’s happening in business.
And every morning I’d think the same thing: there’s a dataset in here. Years of episodes, thousands of stories, hundreds of companies, all locked inside audio. What if the whole run were something you could actually explore? Sort it, chart it, ask questions of it?
So I built a little pipeline that does exactly that. I’m calling it the Yeti Data Brigade, and since I’m about to share it around, I figured I’d explain how it works. I have a hunch a few of you will want to peek under the hood.
Here’s the whole thing on one page:
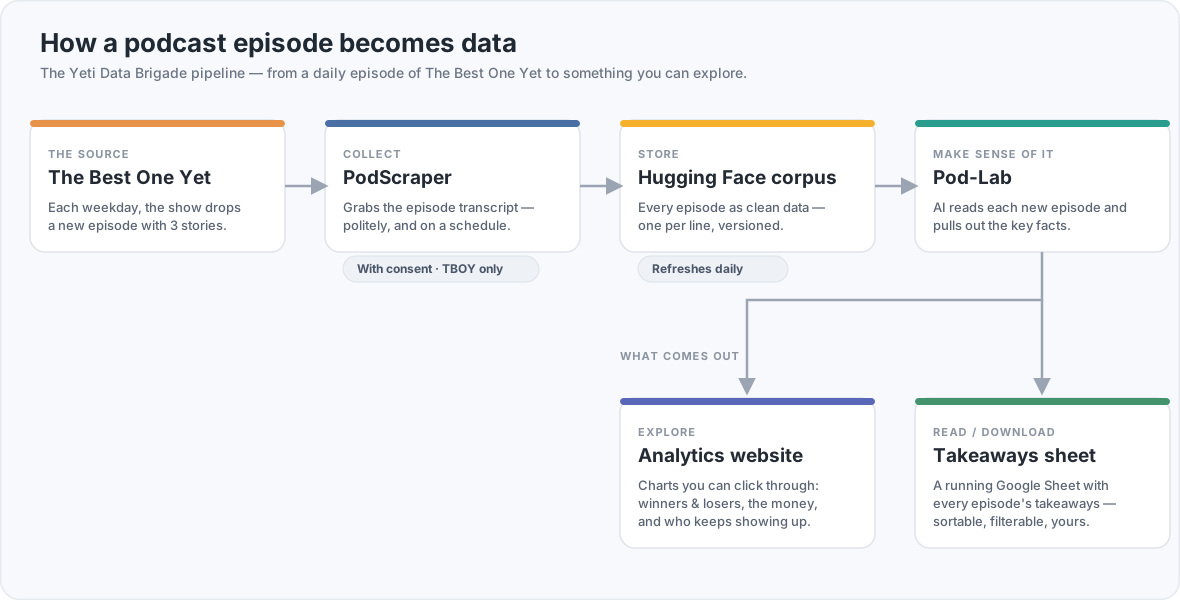
It’s five steps, left to right. Let me walk each one in plain language, and then there’s a section at the bottom for the folks who want the technical detail.
1. The episode
Everything starts with the show. Each weekday there’s a new episode, and inside it are the three stories the hosts picked. That’s the raw material. Nothing happens without it.
2. Grabbing the transcript (politely)
A small service I call PodScraper wakes up on a schedule, notices there’s a new episode, and pulls in its transcript. Two things I care about here:
- It’s polite. It waits between requests, adds a little randomness so it never looks like a hammer, and only ever pulls one thing at a time. Being a good guest on someone else’s website matters.
- It’s consent-first. The scraper only touches shows it’s explicitly allowed to, and right now that list is exactly one: The Best One Yet. The collection is built with respect for the people who make the show, and the data itself stays private and gated rather than thrown open to the world. If you want to build something like this, start with permission, not with a scraper.
3. The corpus: turning transcripts into a dataset
A pile of transcripts isn’t a dataset yet. It’s a pile. This step turns it into something clean and consistent: one episode per line, the same shape every time, versioned so you can see how it grows. It lives on Hugging Face, which is basically GitHub for datasets, a place built specifically for storing and sharing data like this.
Why bother with a “proper” dataset format instead of a folder of text files? Because once the data is uniform and versioned, everything downstream gets easy. Any tool, any script, any person can pick it up and know exactly what they’re looking at. This is the quiet, unglamorous step that makes all the fun stuff possible.
4. Making sense of it
This is where it gets interesting. A second service (Pod-Lab) reads each new episode and uses AI to pull the signal out of the conversation:
- What were the stories?
- Which companies got mentioned, and in what light?
- Were there numbers: a valuation, a raise, a stock move, a market size?
It does this episode by episode, every day, and files the results into a structured store. The transcript goes from “a wall of words two people said” to “a tidy row of facts you can count and sort.”
5. What comes out
Two things, aimed at two kinds of people:
- An analytics website for anyone who likes to click around. It has charts for the stuff that’s actually fun to see over time: winners and losers, where the money went, which companies and people keep showing up and how they’re connected.
- A running spreadsheet of takeaways for anyone who’d rather just have the data. Every episode, with its stories and takeaways, is sortable, filterable, and easy to drop into your own analysis.
That’s the whole loop. A new episode airs, and within a day it’s been transcribed, structured, charted, and added to the sheet, with no one lifting a finger.
Why build it this way?
A few choices I made on purpose, in case they’re useful to you:
- It’s standing, not one-off. It doesn’t scrape “the archive” once and stop. It’s always on, and it keeps itself up to date. The dataset is alive.
- It’s idempotent: a fancy word for running it twice doesn’t double anything up. If nothing new happened, it quietly does nothing. That safety net is what lets me leave it unattended.
- It uses cheap AI where it can. The daily “read the new episode” work runs on smaller, cheaper models, because most of it is ordinary. I save the expensive thinking for the parts that actually need it. (I’ve written before about matching the model to the work.)
- It’s built in the open, warts and all. It’s early, and it breaks sometimes. A piece jams and I go find out why. That’s the honest reality of building a living system, and I’d rather show you the real thing than a polished demo.
For the curious: the technical version
If you don’t care about the plumbing, you can stop here. You’ve got the whole picture. For those who do:
- PodScraper is a small TypeScript/Next.js service running as a scheduled job on Google Cloud, writing episodes into a Postgres database. It enforces the consent allowlist in exactly one place in the code (default: deny) so a podcast can never be published by accident.
- The corpus is a Hugging Face dataset: one JSONL file (one episode per line) plus a small manifest describing what’s in it. Publishing is content-addressed and idempotent. It only commits files that actually changed.
- Pod-Lab is a Python pipeline on a daily cron. It reads the corpus, extracts and enriches each new episode with an LLM, stores results in Postgres, and publishes two ways: charts on a small web app, and a Google Sheet it prepends to. It resumes from where it left off, so a re-run never re-does finished work.
- The whole thing is deliberately loosely coupled: the scraper doesn’t know Pod-Lab exists, and Pod-Lab doesn’t know how the transcripts were collected. They only agree on the dataset in the middle. That seam is what lets either side change without breaking the other. It’s the single most important design decision in the whole system.
Want in?
This is meant to be a brigade, not a solo project. If you’re part of the TBOY community and something here sparks an idea (a chart you wish existed, a question you’d love to ask the data, a way you’d use it), I’d genuinely love to hear it. The hard part (turning a daily show into clean, structured data) is done and running. The fun part (figuring out what’s worth asking) is wide open.
Reach out, and let’s see what’s in there.